Controlled Voltage Simulation Results
Now, the simulation is going to be conducted first for controlled voltage of the SEPIC. Then, the entire system for the controlled voltage rectifier SEPIC circuit. the components and PI coefficients values and SEPIC controlled voltage are shown below.
Table 3‑9 rectifier SEPIC components and PI coefficients values.
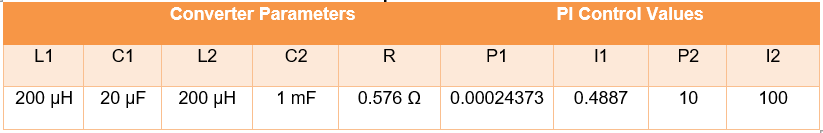
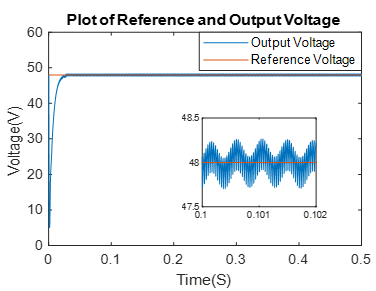
Figure 3‑32: Simulated Results of Controlled Voltage SEPIC.
The final results for the entire rectified SEPIC are displayed below:
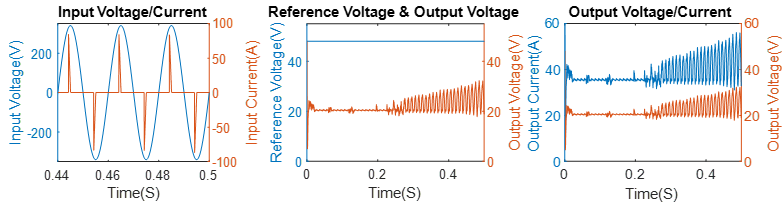
Figure 3‑33: Simulated Results of Controlled Voltage SEPIC.
The resulted THD is 257.1%, and the comparison between the simulation and the model results re shown below:
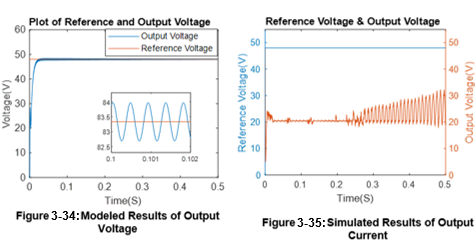
As shown in the figures above, once the modeled PI coefficients were used in the simulation of the real system, the system fails to compensate for the error in the control circuit. this could be happening because the transfer functions developed earlier for both the controlled voltage and controlled current are not correct. Another possibility is that the simulation solver is not set to properly solve this simulation.