[vc_row][vc_column][vc_column_text]
As mentioned earlier, the aim of this project is to design an EV charging infrastructure for several EV stations inside existing QU campus parking space, by studying the distribution network of QU and specificities facilities of every single building. As a designer, it is necessary to gather all information that can help achieve the design objectives. Therefore, designing EV station infrastructure in QU needs specific information about the distribution network of QU such as the single-line diagram and all related data. The distribution network consists of KAHRAMAA main station connected to other on-campus substations that are supplying power to different buildings and facilities, which are managed by QU Facilities and General Services Department (QU-FGSD). This process of data collection was a very challenging task and several difficulties were encountered.
[/vc_column_text][/vc_column][/vc_row][vc_row][vc_column][vc_column_text]
Data Collection
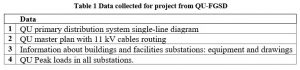
Several meetings were organized with the Project Engineer of the technical service section at QU-FGSD to collect the needed information and data about the QU distribution network. The list of requested data is shown in Table 1.
Challenges with Collected Data
The main drawing used in this project is the QU south primary single-line diagram to simulate the effect of connecting EV charging stations to the QU distribution system. However, the drawings were so complicated that it took a long time to understand them. Therefore, multiple meetings were arranged with the QU-FGSD to discuss the drawings and acquire more information and data. It was noticed that these drawings are missing a lot of information, especially for the old buildings. To overcome the problem of missing information about old buildings while doing the simulation in ETAP software, some assumptions are considered as explained in detail in the next sections.
Consequences of Delays in Collecting Data and Missing Information
The more difficult step in any project or research is in data collection. In this case of missing data, the designers should search for alternative solutions to be able to conduct the analyses as fast as possible within the project deadlines. However, this process may consume considerable time while searching for a solution and may reach to a poor alternative way to get near desired data.
Solving Problem of Missing Data in Old Building of QU
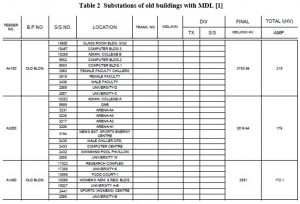
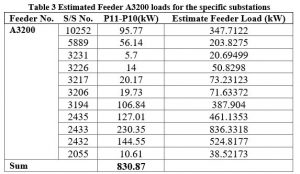
As mentioned previously in the data collection section, many data are missing and could not be provided by the QU-FGSD. The drawing of the university south primary single-line diagram, which is the main drawing used for simulation, misses all the total connected load data in the old buildings substations. This information is essential because, without that information, the simulation cannot be simulated with its exact loading. To solve this problem, the monthly meter reading of all QU substations in 2016, were acquired from the QU-FGSD. Then, the percentages of the missing old substations feeders loading were estimated from these meter readings. Indeed, since the aggregated total load of the feeders in these substations is known from collection data, as shown in Table 2, it is possible to estimate the load on each feeder using the calculated feeder loading percentages.
Estimation Missing Feeder Loading in Old Substations
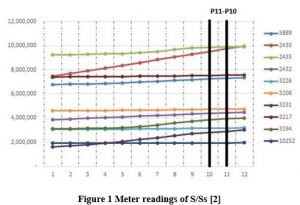
Meters readings from the old substations give an accumulative power consumed every month. The difference between the meter readings of any two consecutive active months can be calculated. Then, the calculated difference is divided by the sum of all substation’s load and multiplied by the main demand load (MDL) of the feeder to get approximately the load on each substation. Figure 1 shows the meters reading of a set of substations which are connected to the same feeder. As discussed earlier, the active months are October and November, which are workings months at QU.
Equation (1) is used to estimate any feeder’s load, where P10 and P11 indicate meter readings during moth October and November, respectively,
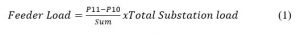
Table 3 lists an example of feeder load estimation results for feeder A3200.
[/vc_column_text][/vc_column][/vc_row][vc_row][vc_column][vc_column_text]
Effects of COVID-19 Pandemic on Project Progress
Because of the COVID-19 pandemic declared by the World Health Organization (WHO), and following the Qatari Government’s decision to apply home confinement to most citizens in the country, QU prevented students, faculty and most of the staff to enter the campus for their own safety. Therefore, all classes shifted quickly from face-to-face in-class delivery to online and distance learning and teaching. All students are studying from their homes and all Faculty and Staff are working from home. Under this tragic and critical circumstance, the QU-FGSD could not provide essential data such as Lighting Distribution Boards (DBs) layout and cables size and length, Empty lands with no planned project on them, and layout from the main DB to the lighting DB. Besides, a site visit to some of the substations could be great to know the peak load and the maximum demand hour. Another visit to Tarsheed Photovoltaic Station could improve the design for PV panels and EVCS, by knowing the configurations used, type of inverters, type of PV panels. To overcome such problems, published papers and industrial reports and equipment datasheets were consulted and used.
[/vc_column_text][/vc_column][/vc_row][vc_row][vc_column][vc_column_text]
[1] UPDATED INFRASTRUCTURE DESIGN FOR QATAR UNIVERSITY FROM UNIVERSITY SOUTH PRIMARY (P319), Doha, Qatar: KAHRAMAA, 2016.
[2] M. K. Pulprayakath, UTILITY METERS READING AT QU, Doha, Qatar: Qatar University, 2017.
[/vc_column_text][/vc_column][/vc_row]