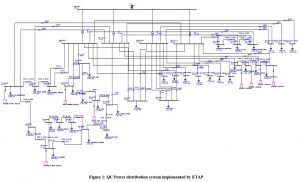
Figure 1 shows the QU power distribution system modeled with ETAP. ETAP can simulate the system in real-time using a tool called “real-time power flow analysis. The first grid bus on the ETAP model that is the “University South Primary (P 319)”, represents the connection to the 132 kV KAHRAMAA grid. Four 40 MVA, 132/11 kV transformers feed the entire university and are connected to the grid bus. The transformers are feeding the substations through 11 kV feeders specified by the QU-FGSD. Each substation is represented as a bus with an ID number and its load (as a static load) with the name of the building that the load represents as its name.
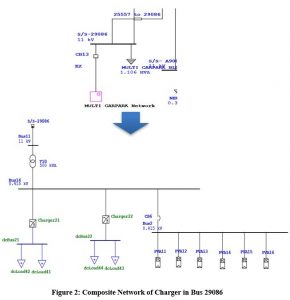
To make the simulation’s look simpler the chargers were added to the system in a composite network, which is a block that opens a new blank sheet to draw the network on it and still be connected to the bus connected to the composite network in the main sheet. Figure 2 shows how a composite network block looks like in the main sheet and after clicking on it to enter the new sheet with the chargers and the PV panels drawn on it. Inside every composite network a group of chargers and PV panels are connected to it. The charger used in this model is SIEMENS’s CPC150. Besides, ETAP has a block that contains a PV panel and its inverter all in one, so it can be connected directly to an AC in the model.