In this part simulation and theory were compared to prove that they are matched and allow to proceed to the practical part with confidence. The table below shows the results obtained for the output power versus the angle calculated and simulated. The inductor value used was 10.23uH as a fixed value for both cases.
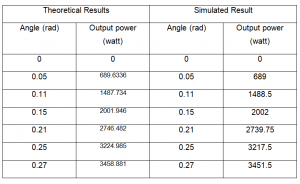
Shown in the previous table the values for the output power calculated are very close thanks to the closed-loop controller which maintains the power by changing the phase angle when necessary. This controller combined with matching voltage for (V1) representing the grid and (V2) representing the battery allowed for such close results. Finally, the results shown in the table for the simulation are the power drawn from the respective source however, the power delivered will be slightly less due to losses, for instance, the power delivered to the battery at full power mode is 3312.45 this means that the charger has an efficiency of 95.9% in this case and for other cases, the efficiency is higher than 90% which achieves a constraint of this project.

the above graph further proves the results seen in the table and shows how close the theoretical and the simulated values are.