For the K1, K2, and K3 scenarios, it is necessary to study the QU 39-bus radial distribution system by monitoring the buses of the network candidate for implementing the EVCS. According to the KAHRAMAA standards, the voltage fluctuations at any bus should not exceed ±6% the nominal level.
K1 Scenario Results
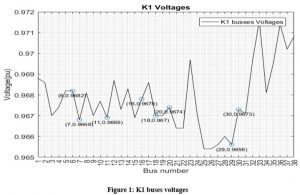
Bus numbers 6, 7, 11, 16, 18, 20, 29, and 30 represent substations that feed the selected parking area to integrate EVCS. Figure 1 illustrates the variation of bus voltage (in per unit). Notice that all the selected buses have a voltage within the standard limits of ±6% the rated voltage, since all the concerned buses have voltages ranging between 0.968 and 0.965.
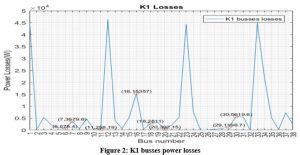
Also, the study should include the losses of each bus of the network. As shown in Figure 2, the highest losses occur at the four main buses (1,12,23,33) of QU because these buses load very high current through their cables. On the other hand, buses used in this study are relative, not significant compared to other buses.
K2 result
Figure 3 shows the bus voltages for the K1 and K2 scenarios.
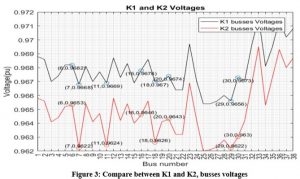
Notice that there is a voltage drop in the whole system for the K2 scenario due to load increase. The voltage drop is very high in bus numbers 7 and 16 as the number of installed EVCS are 30 and 24, respectively (for the 75 kW EV charger). For bus numbers 11 and 18, there is a noticeable voltage drop since there are 12 EVCS at each bus. For other buses, the numbers of EVCS are not significant, so the effect was small.
Figure 4 shows the losses in all systems’ buses for the K1 and K2 scenarios. The losses in the main four buses (1, 12, 13, 33) increase since the new loads absorb more power, which will increase the current flowing in the main buses.
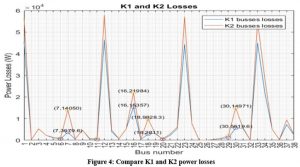
In the buses that have a high number of EVCS, the losses are high. For example, in bus 7, the losses in K1 were 3679.6 W, but in K2, it reaches 14050 W with an increase of 382% in the power losses. Besides, the percentage of the loss in bus 29 approximately 7% due to the number of EVCS, which is 4. All the losses are reasonable and predictable.
K3 Scenario Result
Figure 5 shows the three cases voltages on each bus, and there is an effect on the busses voltage in the whole system. Although the generated power did not decrease the voltage drop to reach K1 scenario bus voltages, it reduces the gap and improves the voltages in the entire system. The power generated by the PV panels equals 7.6 MW, which is more than the power absorbed from the EVCSs that equals 7.3 MW. However, the limited area around each parking prevents the installation of more PV panels such as it can compensate for the losses.
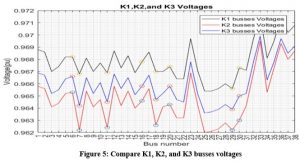
Bus number 20 has one EVCS that consumes 150 KW, but it generates around 1.1 MW. Besides, the PV panels produce DC power, which means that the reactive power will not be restored—knowing that the chargers take real and reactive power.
Figure 6 shows that the total power losses in the overall system decrease during the K3 scenario. At bus 7, the loss is reduced from 14,050 W to 7,059W, which is approximately 50% in K3 compared with K2 scenario.
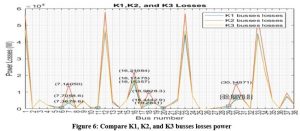
Note that, the simulated PV panels produce the maximum power, which means that on a sunny day during summer at noontime. Meanwhile, all the simulated chargers work at the same time with full power. As a result, the losses curve will certainly change, but it will not exceed the K2 scenario losses as it shows the worst-case when PV panels do not work and for which it did not exceed the limit or violate the voltage drop limit constraint.